
Hybrid Monitoring solution using Azure Monitor Part 1 : Architecture Overview
Posted 01 January 2024
By Ramy RZEM
8 min read
Hybrid Monitoring solution using Azure Monitor/ Grafana 📈
This is about a monitoring solutions for on promise servers using Azure Monitor and Azure Managed Grafana for visualisation. This is a multi-part blog series due to the length of content.
Monitoring Solution Target
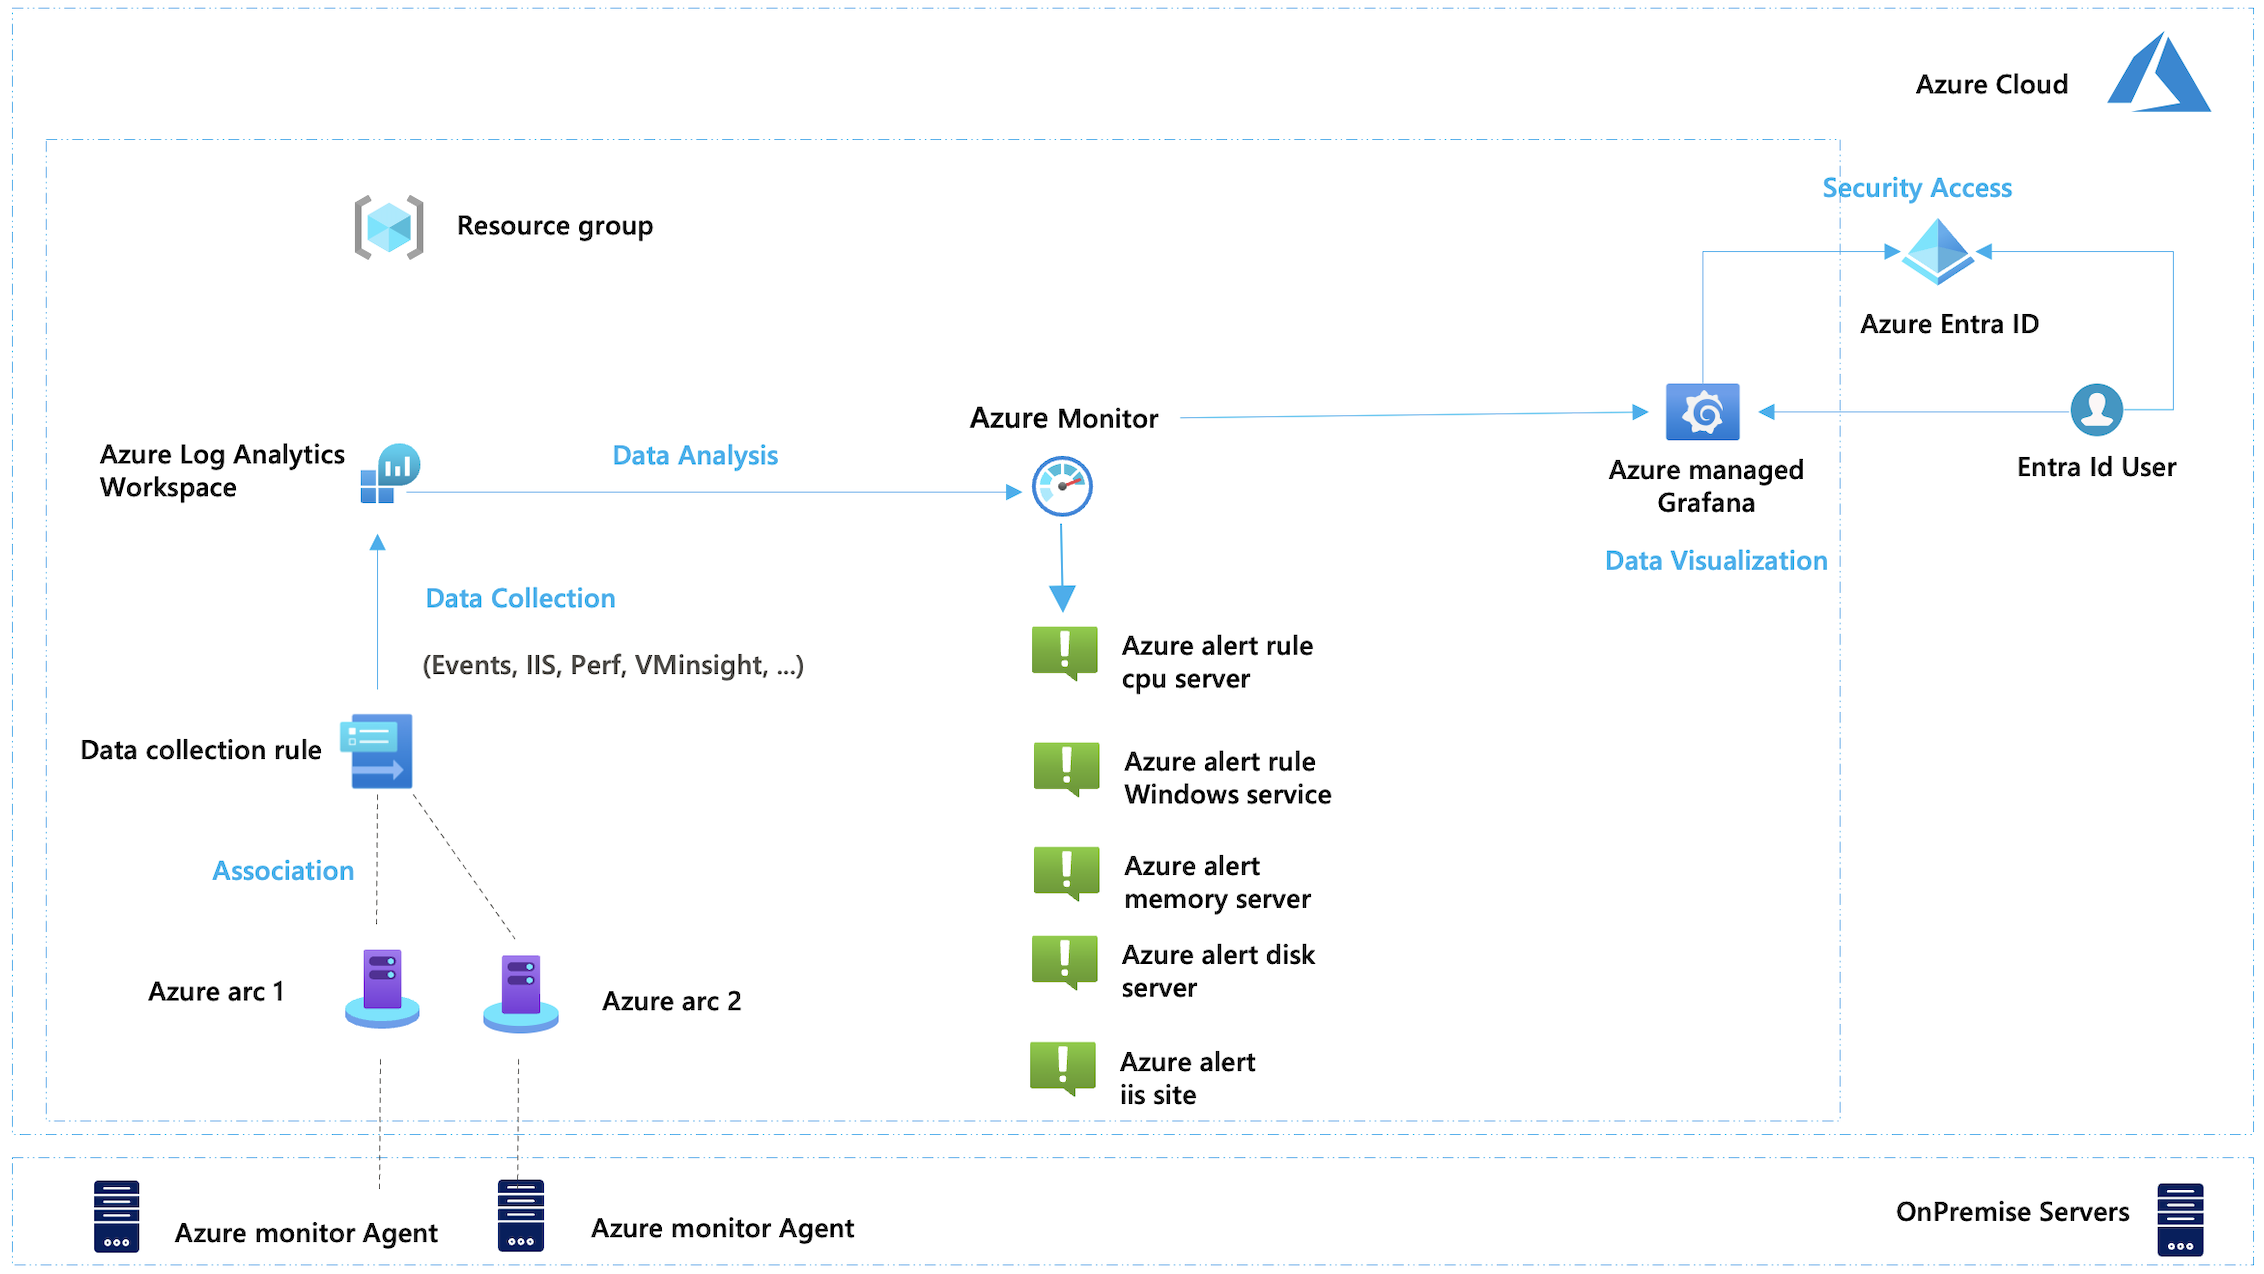
Having a centralized Dashboard to monitor application health check and to be warn asap when an incident appear is a must nowadays. Our solution will collect Data logs from multiple OnPremise servers, transform, analyse and show them into a dashboard visualisation using Grafana. Also we will create alerts notifications for different cases.
Architecture Design
Prerequisites
Before you start, ensure you have the following:
- An Azure subscription and Azure Entra Id.
- GitHub organization.
- The necessary permissions to create service connections Federation between Azure/ GitHub.
We will have step-by-Step guide to create an Azure infrastructure to deploy azure resources using Terraform
- Application registration.
- OnBoarding Azure Arc machines.
- Data Collection : DCR transformation pipeline Queries/ DCE/ DCA.
- Data Analysis : Log Analytics Workspace, queries, alerts.
- Data visualisation : Queries and Azure managed grafana.
- Implement the solution using Terraform hosted on GitHub.
- CI/CD using GitHub actions.
Conclusion:
This part gives us an overview about the monitoring solution to be implemented let's jump on the second part and onboard Arc machinesFor detailed instructions and more information, refer to the official Microsoft documentation.